
We often get asked by our users if we can provide notifications for the customers that are approaching a limit in their products. Visibility into that type of information is incredibly useful, particularly for startups trying to identify their most active users or those ready for an upsell conversation.
However, it’s often challenging data both to get and to visualize in a user-friendly way that folks can act on. That’s because this type of data is often locked in application databases that need to be queried carefully & manually. Fortunately, Schematic supports metered features, and tracks data about limits and utilization on a per feature and per customer basis, which can be retrieved via our API.
In this tutorial, we'll build a small app that monitors feature usage across a customer base and triggers webhook notifications when customers are reaching usage limits. We'll use Next.js, Schematic's API to retrieve allocation and usage data for individual features, and webhook notifications for alerting.
In the future, Schematic will natively support triggers for limits, but we can easily implement something similar with data from Schematic today and customize to your specific use case.
You can find all the code associated with this tutorial here.

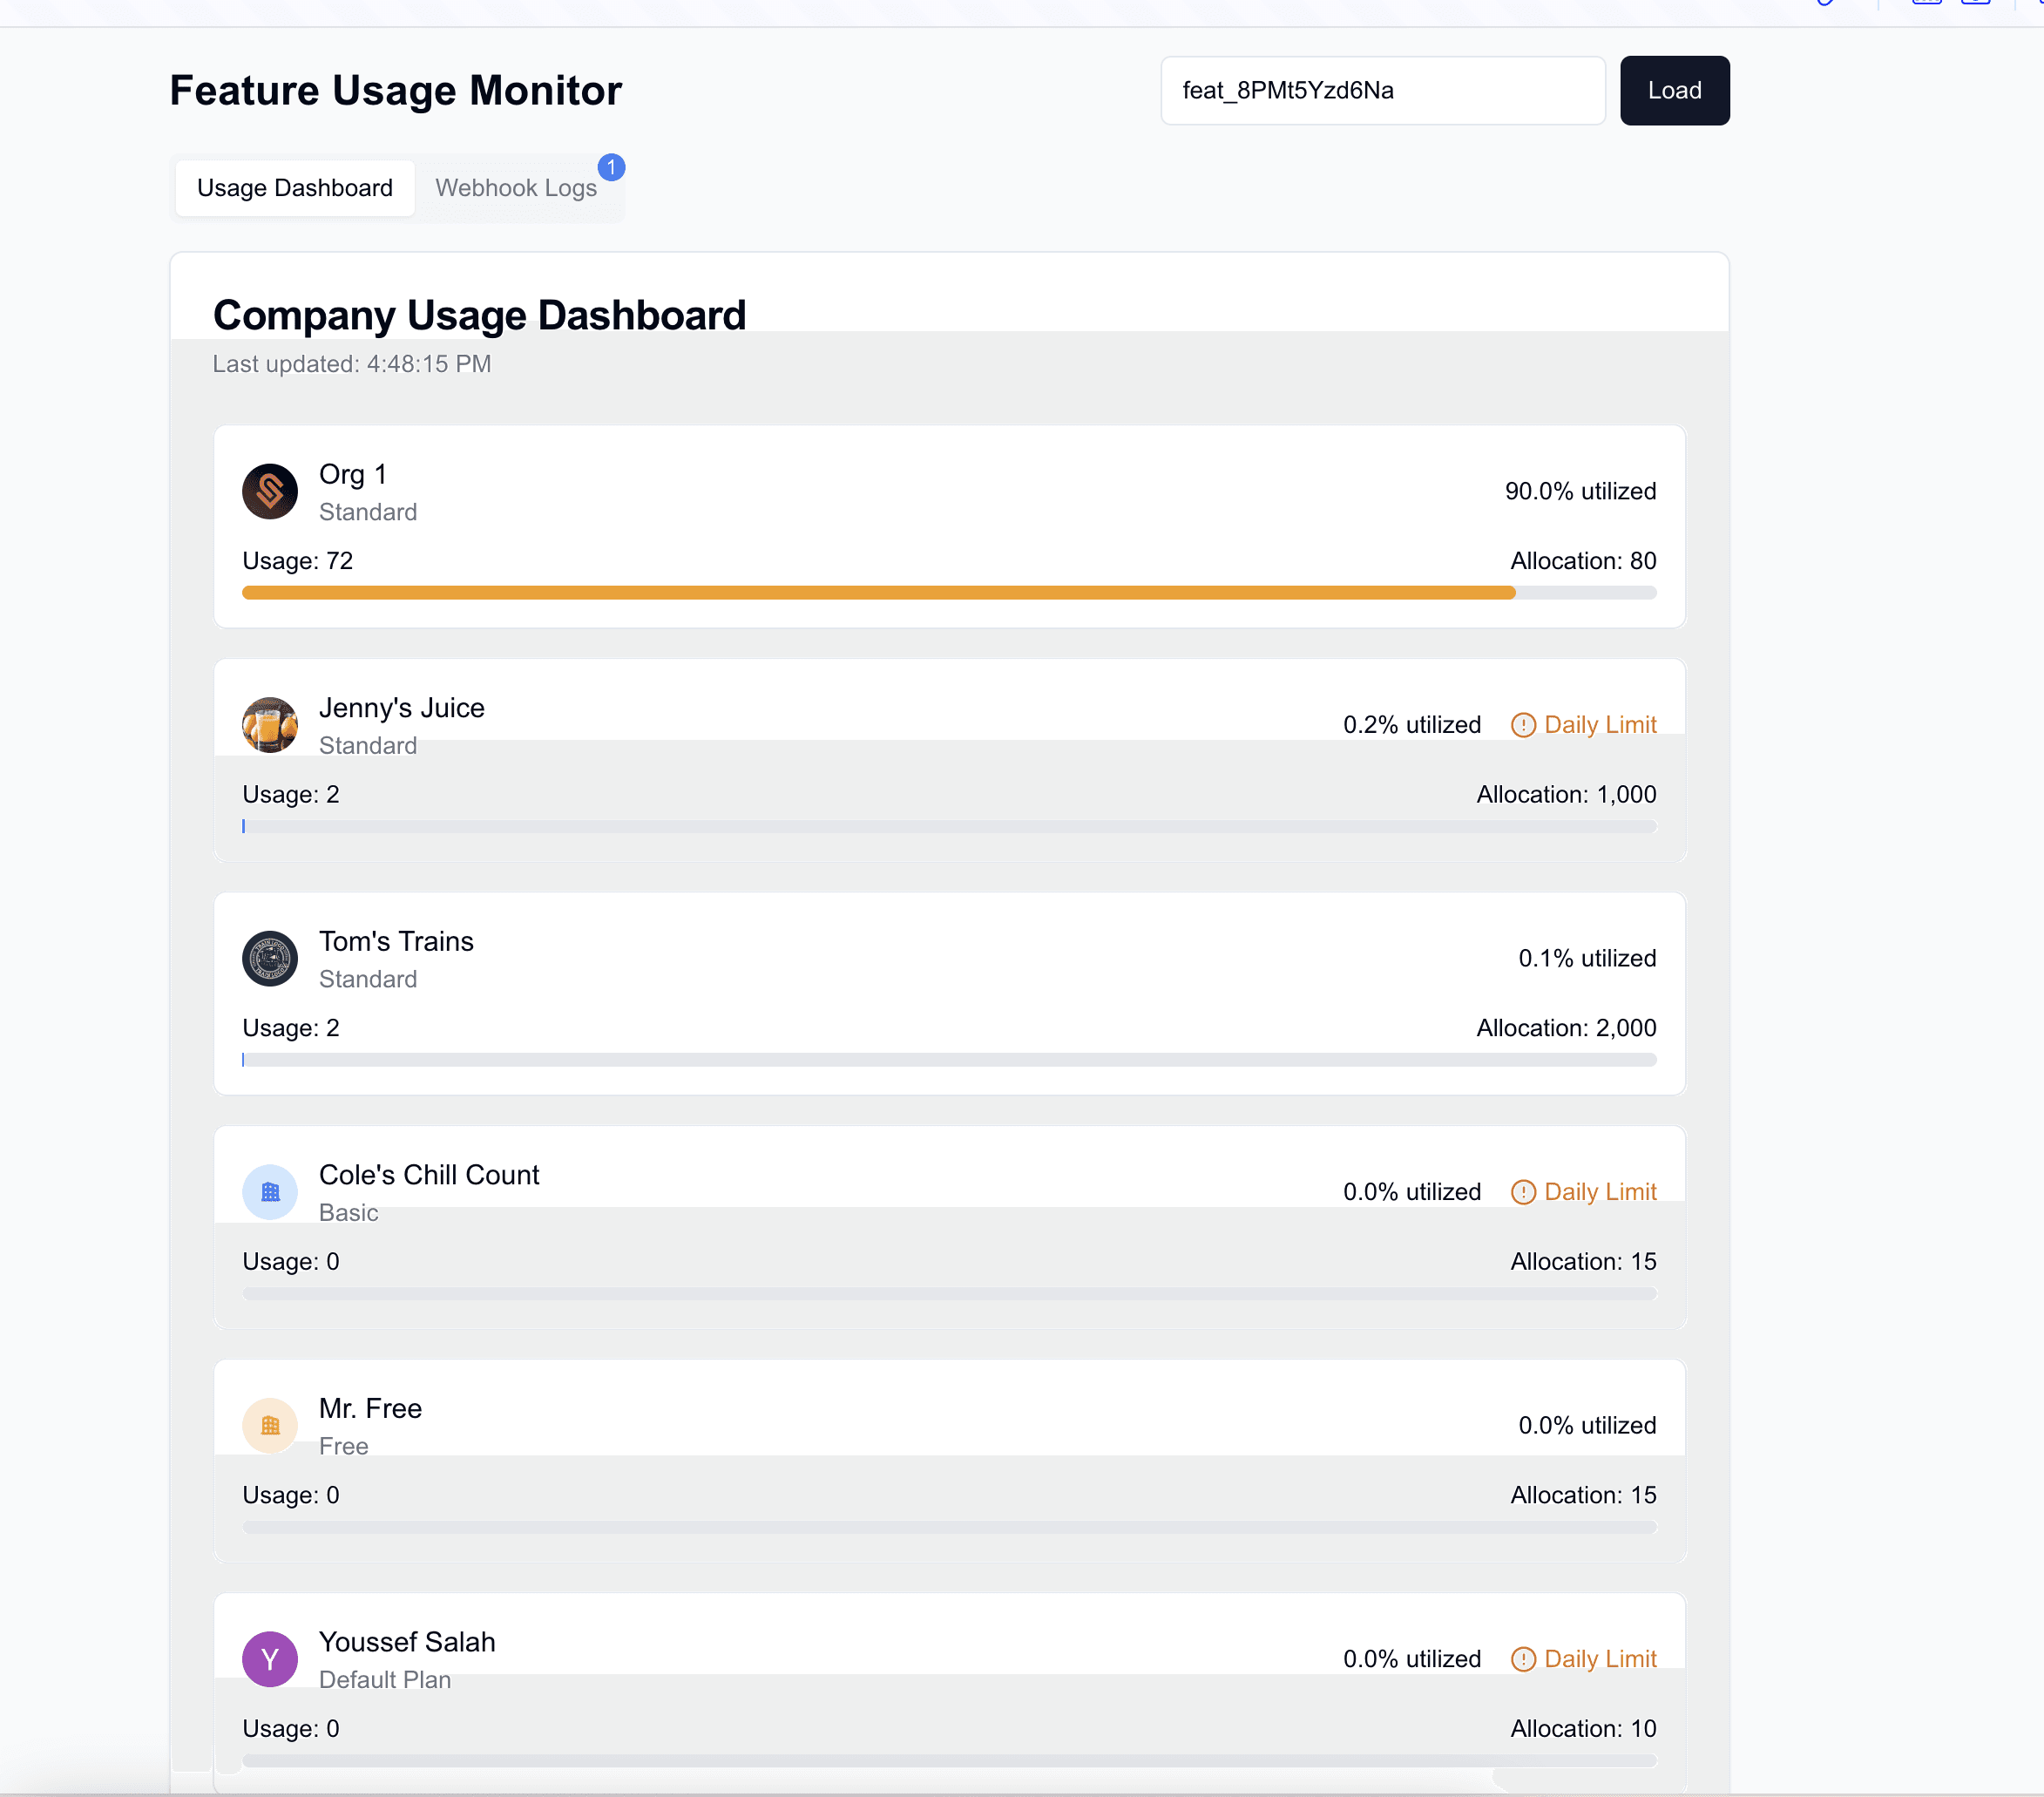
We'll create a dashboard that:
Displays feature usage across all companies using your product
Automatically polls for updates every 5 minutes
Triggers webhook notifications at 80%, 90%, and 100% usage thresholds
Provides a log of all threshold notifications
Before starting, you'll need:
Node.js 18 or higher installed
A Schematic account that’s instrumented with metered features
A webhook endpoint for receiving notifications (optional)
Create a new Next.js project:
npx create-next-app@latest usage-monitor --typescript --tailwind --eslint
cd /usage-monitor
Install dependencies:
npx shadcn@latest init
npx shadcn@latest add card alert input button tabs
npm install @schematichq/schematic-typescript-nodeCreate an API route to handle feature usage data from Schematic:
// app/api/feature-usage/route.ts
import { NextRequest, NextResponse } from "next/server";
import { SchematicClient } from "@schematichq/schematic-typescript-node";

const DEFAULT_PAGE_SIZE: number = 100;

export async function GET(request: NextRequest) {
  const apiKey = process.env.SCHEMATIC_SECRET_KEY;
  if (!apiKey) {
    return NextResponse.json({ message: "No Schematic key" }, { status: 400 });
  }

  const searchParams = request.nextUrl.searchParams;
  const featureId = searchParams.get('featureId');
  const offset = parseInt(searchParams.get('offset') || '0');
  const limit = parseInt(searchParams.get('limit') || String(DEFAULT_PAGE_SIZE));

  try {
    const schematicClient = new SchematicClient({ apiKey });
    const response = await schematicClient.entitlements.listFeatureCompanies({
      featureId,
      limit,
      offset,
    });

    return NextResponse.json({
      data: response.data,
      pagination: {
        offset,
        limit,
        total: response.data.length,
        hasMore: response.data.length === limit
      }
    });
  } catch (error) {
    return NextResponse.json(
      { message: "Failed to fetch feature usage data" },
      { status: 500 }
    );
  }
}
Create a notification endpoint that triggers webhooks at 80%, 90%, and 100% of a given limit for a feature:
// app/api/usage-notifications/route.ts
import { NextRequest, NextResponse } from "next/server";
import { SchematicClient } from "@schematichq/schematic-typescript-node";

const THRESHOLDS = [80, 90, 100];

export async function POST(request: NextRequest) {
  const apiKey = process.env.SCHEMATIC_SECRET_KEY;
  if (!apiKey) {
    return NextResponse.json({ message: "No Schematic key" }, { status: 400 });
  }

  const { featureId } = await request.json();
  const schematicClient = new SchematicClient({ apiKey });

  try {
    const response = await schematicClient.entitlements.listFeatureCompanies({
      featureId,
    });

   const notifications = [];

    for (const company of response.data) {
      const usagePercentage = (company.usage / (company.allocation || 1)) * 100;

      for (const threshold of THRESHOLDS) {
        if (usagePercentage >= threshold) {
          notifications.push({
            companyId: company.company.id,
            companyName: company.company.name,
            threshold,
            usage: company.usage,
            allocation: company.allocation,
            timestamp: new Date().toISOString()
          });

          if (process.env.WEBHOOK_URL) {
            await fetch(process.env.WEBHOOK_URL, {
              method: 'POST',
              headers: { 'Content-Type': 'application/json' },
              body: JSON.stringify({
                companyId: company.company.id,
                threshold,
                usage: company.usage,
                allocation: company.allocation
              })
            });
          }
        }
      }
    }

    return NextResponse.json({ notifications });
  } catch (error) {
    return NextResponse.json(
      { message: "Failed to process notifications" },
      { status: 500 }
    );
  }
}Create types for the Schematic API response:
export interface Company {
  company: {
    id: string;
    name: string;
    logo_url: string;
    plan?: {
      name: string;
    };
  };
  period: string;
  usage: number;
  allocation: number | null;
}

export interface PaginationState {
  offset: number;
  limit: number;
  total?: number;
  hasMore: boolean;
}

export interface ApiResponse {
  data: Company[];
  pagination: PaginationState;
}This dashboard component fetches and displays usage data, sorted by utilization percentage:
export interface CompanyUsageListProps {
  data: ApiResponse | null;
  addWebhookLog: (log: WebhookLog) => void;
}

export const CompanyUsageList = ({
  data,
  addWebhookLog
}: CompanyUsageListProps) => {
  const companies = data?.data || [];

  // Sort companies by utilization percentage
  const sortedCompanies = [...companies].sort((a, b) => {
    const percentageA = calculateUsagePercentage(a.usage, a.allocation);
    const percentageB = calculateUsagePercentage(b.usage, b.allocation);
    return percentageB - percentageA;
  });

  return (
    <div className="space-y-4">
      {sortedCompanies.map((company) => {
        const usagePercentage = calculateUsagePercentage(company.usage, company.allocation);

        return (
            // ... company usage list layout ...
  );
};Set up threshold checking and webhook notifications:
useEffect(() => {
    const checkUsageAndNotifications = async () => {
      await fetchData(featureId);
      // Call our notifications endpoint
      try {
        const response = await fetch('/api/usage-notifications', {
          method: 'POST',
          headers: {
            'Content-Type': 'application/json',
          },
          body: JSON.stringify({ featureId })
        });

    return () => clearInterval(interval);
}, [featureId]);Implement automatic refresh of data from Schematic:
const POLLING_INTERVAL: number = 5 * 60 * 1000; // 5 minutes

export const CompanyUsageApp = () => {
  // ... state setup ...

      const setupPolling = useCallback(() => {
	    if (pollInterval.current) {
	      clearInterval(pollInterval.current);
	    }

          pollInterval.current = setInterval(() => {
	      fetchData(featureId);
	    }, POLLING_INTERVAL);

            return () => {
	      if (pollInterval.current) {
	        clearInterval(pollInterval.current);
	      }
	    };
	  }, [featureId]);

  // ... rest of component
};Pull together the full dashboard component. It will include:
An input field for the feature ID
List of companies with utilization and allocation
Pagination support
The code for that is here.
There are several next steps you could take to improve upon this, including:
Adding email notifications that go directly to account owners
Implementing custom threshold settings
Support for monitoring every metered feature at once, rather than one at a time
Adding historical usage tracking for trend analysis
Adding database persistence for notification history